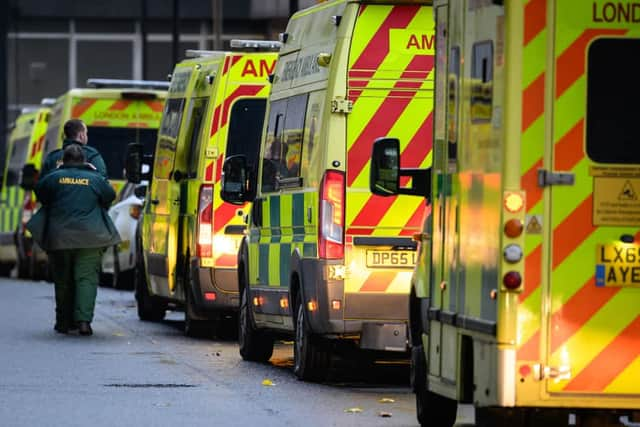
How long are people having to wait for an ambulance in Birmingham?
and live on Freeview channel 276
New figures have unveiled the local areas in England with the longest ambulance delays, latest figures show
Potential heart attack and stroke victims in the worst hit areas are now waiting an average of one hour and 40 minutes for paramedics to arrive. Life-threatening incidents such as a cardiac arrest fall under C1 and represent the most serious of call-outs. Less immediate incidents fall into categories two (emergency), three (urgent) and four (less urgent).
Advertisement
Hide AdAdvertisement
Hide AdThe figures from 2021/22, uncovered by the Liberal Democrats through Freedom of Information requests, reveal how patients whose lives are in immediate danger are waiting three times longer in some rural areas than urban ones.
Figures were provided by all ten ambulance trusts in England, revealing local figures on response times that aren’t published in the regular region-wide data. The research covers 227 local areas in England, showing the worsening picture across the country.
Of these, all but two are failing to reach the 18-minute target for Category 2 calls which can include heart attack and stroke victims, while 83% of areas missed the 7 minute target for the most serious Category 1 calls. Not one area in England achieved the target for both Category 1 and 2 calls.
Not one local area in the country is meeting both Category 1 and Category 2 response time targets.


What do the figures show for the West Midlands and Birmingham?
Advertisement
Hide AdAdvertisement
Hide AdFor category 1 calls, at the NHS Black Country and West Birmingham CCG, average response times were 6 minutes and 20 seconds, meaning the Trust hit the 7 minute target.
At the NHS Birmingham and Solihull CCG, average response times were 6 minutes and 29 seconds.
With category 2 calls, the data shows that at the NHS Birmingham and Solihull CCG, average response times were 32 minutes and 20 seconds - meaning the Trust is failing to hit the 18-minute target for category 2 calls.
At the NHS Black Country and West Birmingham CCG, average response times for category 2 calls were 20 minutes and 29 seconds, meaning the Trust just failed to hit the response time target.
How do these times compare with the rest of the country?
Advertisement
Hide AdAdvertisement
Hide AdIn Mid Devon, patients waited an average of 15 minutes and 20 seconds minutes for Category 1 calls, the longest in the country, compared to 5 minutes and 48 seconds in Hammersmith.
10 worst areas for in England average Category 1 response times (in minutes) in 2021/22 in England
- Mid Devon: 15:20
- West Devon: 15:12
- South Hams: 14:44
- Cotswold: 14:27
- Ribble Valley: 14:09
- Cornwall: 13:50
- NHS South Lincolnshire CCG: 13:43
- Vale of White Horse SW: 13:14
- Forest of Dean: 13:10
- Sevenoaks: 13:09
10 worst areas for Category 2 response times (in hours and minutes) in 2021/22 in England
- Cornwall: 1:41:22
- NHS Lincolnshire East CCG: 1:15:00
- South Gloucestershire: 1:11:47
- North Somerset: 1:09:53
- NHS North East Lincolnshire: 1:09:25
- City of Bristol: 1:09:08
- NHS North Lincolnshire CCG: 1:08:43
- Cotswold: 1:07:54
- Forest of Dean: 1:07:09
- NHS South Lincolnshire CCG: 1:06:49
Comment Guidelines
National World encourages reader discussion on our stories. User feedback, insights and back-and-forth exchanges add a rich layer of context to reporting. Please review our Community Guidelines before commenting.
