


Where are the worst places for crime in Birmingham?
It's a question that's not always easy to answer, but new research has shone a light on the crime rates in different neighbourhoods across the city.
Research conducted by Churchill Support Services has used statistics available from open-source West Midlands Police data to unveil the city's crime hotspots.
The data has been broken down by Birmingham City Council wards and areas in the city. It is then displayed as a ratio of crimes per 1000 people living in the area, spread out across the latest 12 month period (2022 - 23). Crimes including violent crime, vehicle crimes, public order offences, thefts and shoplifting have all been analysed to identify the most dangeorus areas.
As well as the West Midlands Police data repository, to confirm the data, the company also used information from data project CrimeRate and Birmingham City Council’s ward profiles as well as the independent site citypopulation, which collates census data.
Responding to the figures below, a spokesman for West Midlands Police, admitted that there is a need to improve how crime is tackled in Birmingham - but stressed that a lot of progress is already being made. A force spokesperson said: "Since introducing a new, more local, policing model we've seen real improvements in tackling crime and better serving our communities.
"As a police force we're prioritising crimes which cause the most harm such as burglary, robbery, vehicle crime and domestic abuse - and have already seen the highest monthly arrest rate and highest positive outcome rate in recent years. Our new model now sees response, neighbourhood and investigation officers based together so this helps ensure we're in the heart of our communities.
"Since Spring there's been a reduction in overall crime of almost 10 per cent across the region and a faster response to calls for help. We have dedicated teams covering all areas of Birmingham and carry out regular patrols to deter criminals behaviour and catch those who do commit offences. We monitor crime reports daily so we can react to any emerging trends or concerns and carry out regular, targeted operations.
"We know there's always room for improvement, but our new local policing model is already making a difference. It is helping us get better at listening to communities and working with them to act on the issues they tell us matter to them."
We've analysed the statistics to unveil the 12 neighbourhoods that have the worst crime rates in Birmingham. The area with the worst crime rate on the list has a rate of 349.9 crimes per 1000 people, with the 12th worst rate dropping more than 50% with 173.6 crimes per 1000 people.
Overall, the data shows that the city's biggest issue lies in violent crime, with 76,805 incidents recorded over the last year, as well as public order offences (15,439 incidents).
These are the top 12 most dangerous areas of Birmingham according to the research.
Research conducted by Churchill Support Services has used statistics available from open-source West Midlands Police data to unveil the city's crime hotspots.

9. Hodge Hill
Hodge Hill, which is the most deprived constituency in Birmingham, has an overall crime rate of 186.8 crimes per 1000 People. Violent crime: 1828 incidents, shoplifting: 355 incidents and vehicle crime: 339 incidents.

10. Longbridge
The south-west Birmingham area also has a high crime rate. The overall crime rate in the neighbourhood is 179.7 crimes per 1000 people. Violent crime: 1755 offences, criminal damage: 356 offences and theft: 337 offences
11. Kingstanding
Kingstanding has an overall crime rate of 175.9 crimes per 1000 People. Violent crime: 1840 incidents, criminal damage: 386 incidents and public order offences: 323 incidents

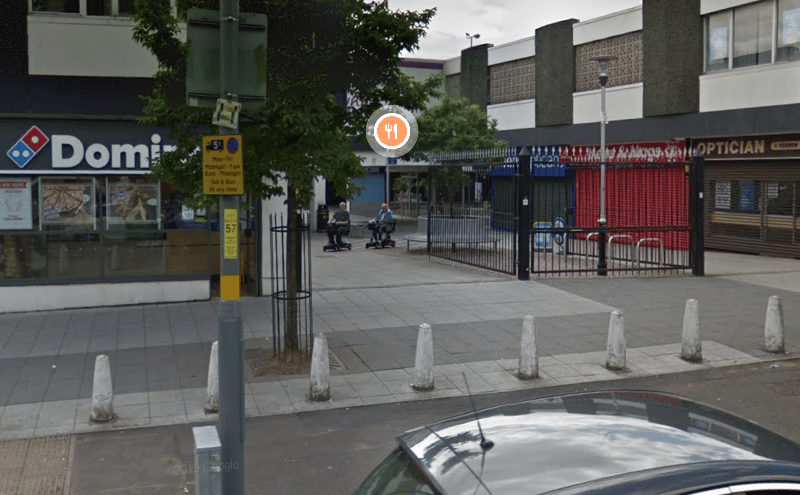
12. Perry Barr
It may be home to the Commonwealth Games' Alexander Stadium, but Perry Barr has a relatively high crime rate as well. The overall crime rate in the neighbourhood is 173.6 crimes per 1000 people. violent crime: 1400 incidents, public order offences: 394 incidents and criminal damage: 300 incidents