
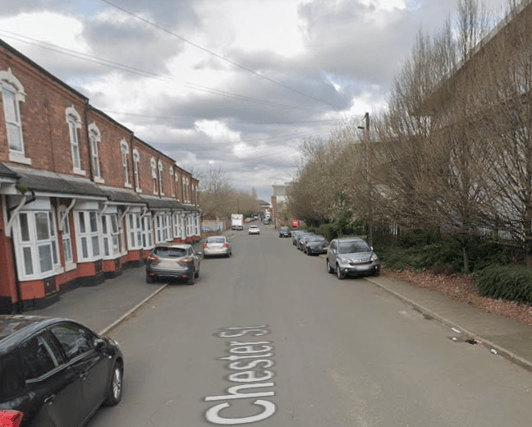


The latest house price data, based on Land Registry figures, was published by the Office for National Statistics on September 18 2025.
The rate at which prices are rising and falling gives an indication of the most up and coming areas of Birmingham as well as where houses are getting cheaper.
The figures, for the year to March 2025, help give us an idea of the places seeing the biggest annual percentage decrease.
Here are the Birmingham neighbourhoods where house prices have fallen the most since March 2024 to March 2025.
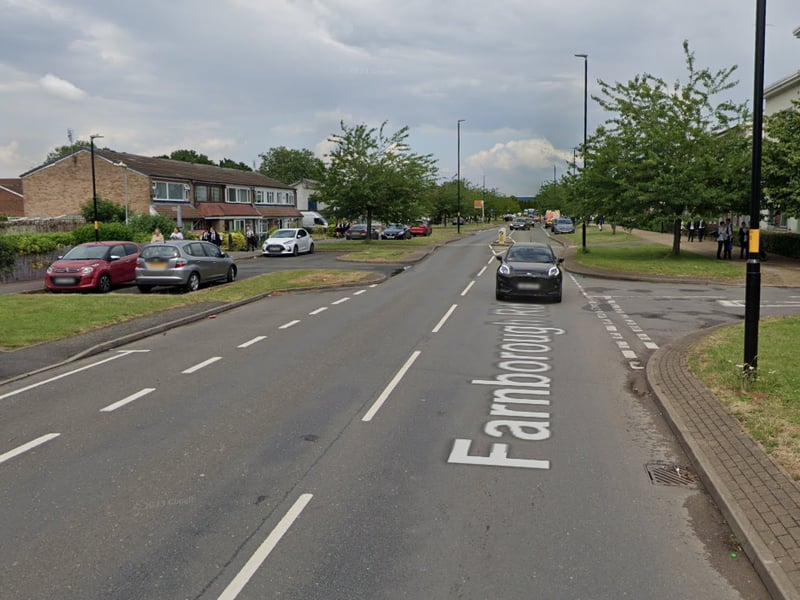
9. Castle Vale
The average house price fell by 9% during the year ending in March 2025, from £200,000 to £182,000 | Google Maps
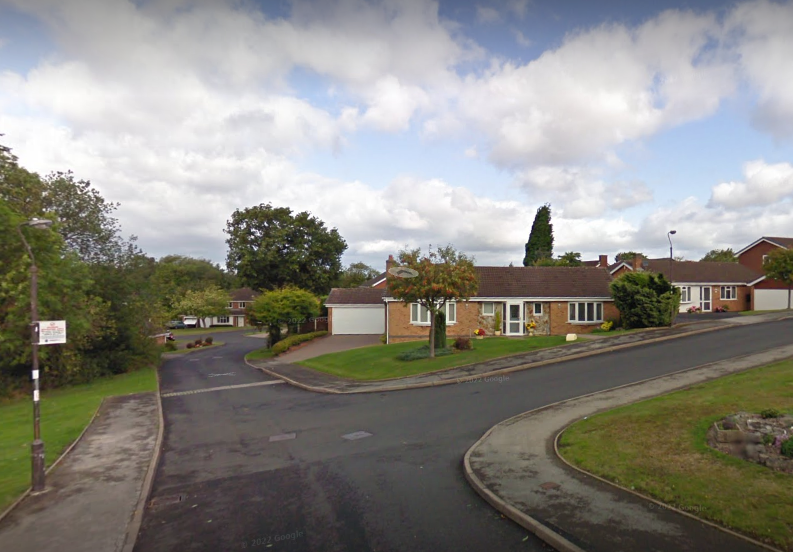
10. Hill Hook, Sutton
The average house price fell by 5.94% during the year ending in March 2025, from £425,000 to £400,000 | google
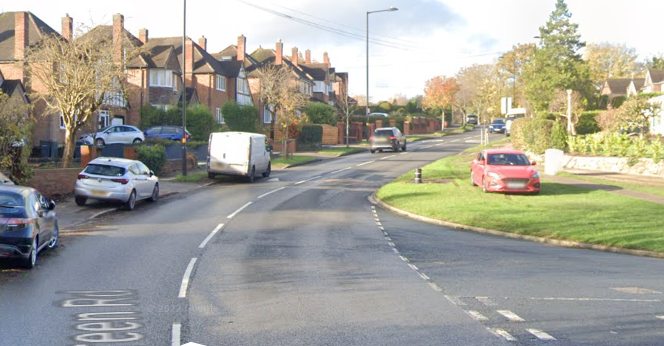
11. Rectory Park & New Hall Valley
The average house price fell during the year ending in March 2025, from £370,000 to £360,000 | Google Street View
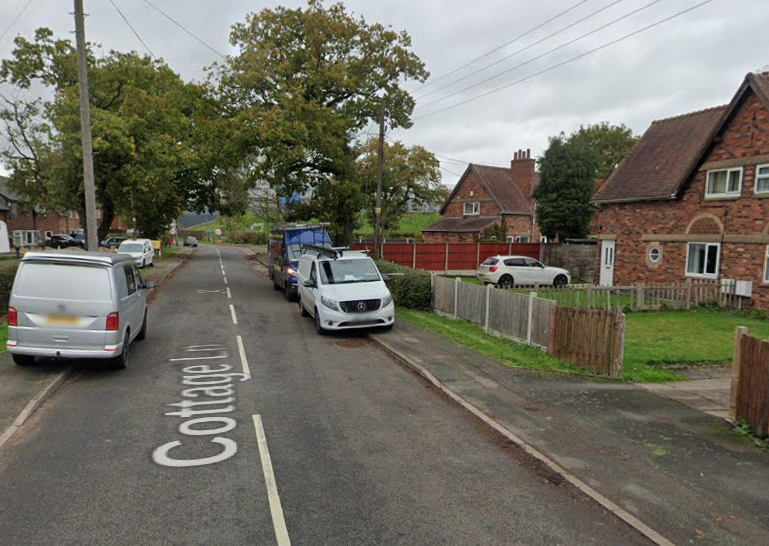
12. Minworth, Sutton Coldfield
The average house price fell during the year ending in March 2025, from £305,000 to £322,350 | Google